
sexta-feira, 18 de novembro de 2016
quinta-feira, 17 de novembro de 2016
FORTE FRENTE FRIA NO SUL

Mas fotos de seguidores desde Rocha!!!!
La misma célula de tormenta generó mas de 3 trombas marinas!!!!
La misma célula de tormenta generó mas de 3 trombas marinas!!!!


LA NIÑA MODOKI

GELO ANTÁRTICO PERMANECE NESSE VERÃO SEM DERRETIMENTO

INVERNO CONGELANTE NA SIBÉRIA E EUROPA

LA NIÑA MODOKI, no meio do Pacífico


LA NIÑA ESTÁVEL

LA NIÑA
In this phenomenon of oscillation, E.N.S.O., the cold phase is called La Niña. The latter is the opposite of El Niño and this can be seen in the SST and atmospheric pressure anomalies of the Pacific.
The waters of the Eastern Pacific are cooler than normal and the waters of the Western Pacific are warmer.
Atmospheric pressures are lower in the West, but higher in the East.
East.The trade winds are stronger and coastal waters of Chile and Peru colder.
The occurrence of this phenomenon depends on the reflection of oceanic waves on the coasts of Indonesia or South America. When Kelvin waves are reflected on the coast of South America in Rossby waves in the West, the thermocline rises to the Pacific East and descends to the West. Then the temperature of the ocean surface varies. The cold water of the thermocline goes up again, cools the surface of the Eastern Pacific, causing instability of the atmosphere-ocean coupling. The trade winds blow more strong pushing the warm surface waters to Indonesia and Australia allowing the upwelling of cold water on the surface.
These anomalies in the temperature of the surface of the Pacific strengthen the depression of Indonesia and Australia and the Eastern Pacific anticyclone.

The classic Nina is a phenomenon that is all the opposite of El Niño classic and has therefore opposite consequences.
The warmer waters in Indonesia gradually warm up 84,2°F (29°C) and the sea level rises of 40 cm on the Western edges of the basin. Which amplifies precipitation southeast Asia and eastern Australia, causing major floodings. Monsoons are also abnormally high in India. South Africa also faces more rain.
But the intertropical islands of the Central Pacific and on the other side of the Pacific : Southern North America, North of Mexico and California... experience periods of pronounced droughts.
This climatic phenomenon increases the number of hurricanes in the Atlantic as it decreases the vertical wind shear. Pacific forces and storm tracks are different as jet stream changes of latitude, they are less frequent.


Comparison between the situation of Classic La Niña (a) and La Niña Modoki (b)
During the classic La Niña, the West Coast of the United States is dry but with La Niña Modoki it is rather humid. While during the Classic La Niña there is a significant increase in rainfall over the north and south of Australia, that the Modoki event seems to lead to a large-scale increase in the precipitations in the northwest and North Australia. India also would be affected by more precipitations with this second type of La Niña.
The warmer waters in Indonesia gradually warm up 84,2°F (29°C) and the sea level rises of 40 cm on the Western edges of the basin. Which amplifies precipitation southeast Asia and eastern Australia, causing major floodings. Monsoons are also abnormally high in India. South Africa also faces more rain.
But the intertropical islands of the Central Pacific and on the other side of the Pacific : Southern North America, North of Mexico and California... experience periods of pronounced droughts.
This climatic phenomenon increases the number of hurricanes in the Atlantic as it decreases the vertical wind shear. Pacific forces and storm tracks are different as jet stream changes of latitude, they are less frequent.
La Niña from December to February
 |
La Niña from June to August
 | |||
| Cool and rainy | Warm and rainy | ||
| Warm and dry | Cool and dry | ||
| Cool | Dry | ||
| Rainy | Warm | ||
Variation of the position of the Jet stream during La Niña
Since 2007 a new type of La Niña was discovered from analysis of a Japanese team that have named it La Niña Modoki in Japanese. It is distinguished from the classic La Niña by its specific impact on the global atmospheric circulation.
Traditionally, the classic La Niña is associated with the cooling in the eastern tropical Pacific (Niño 1+2 et 3). However, during La Niña Modoki the anomaly of the sea surface temperature (SST) in the eastern Pacific isn't affected by cooling but by warming just like western equatorial Pacific, while a cold anomaly affects the central equatorial Pacific (Niño 3.4). These zonal gradients of SST result in an anomaly in circulation of two Walker cells on the tropical Pacific, with a humid region in the Eastern and the Western Pacific. The thermocline doesn't switch the same way as during the classical La Niña because this one raises at the Eastern Equatorial Pacific to sink at the West while during its cousin the thermocline raises at the center of equatorial Pacific Ocean and sinks at each end of the Pacific.
Comparison between the situation of Classic La Niña (a) and La Niña Modoki (b)
- E.N.S.O. index
Ocean surface temperature and atmospheric pressure are constantly measured by moored buoys and satellites around the Earth (Poseidon, Jason...). From these data are calculated indexes giving a more exact idea about the evolution of ENSO.
- - With the anomaly of SST (sea surface temperature), there are four indices that are calculated differently, or rather in different locations.
- El Niño 1+2 (0-10° South) (90° West-80° West),
- El Niño 3 (5° North-5° South) (150° West-90° West),
- El Niño 4 (5° North-5° South) (160° East-150 °West),
- El Niño 3.4 (5° North-5° South) (170-120° West).
Example, if in December to (0-10° South) (90° West - 80 ° West), the average of the SST is 22,32°C then the index is -0,52 as the average in December is 23,84°C to (0-10° South) (90° West - 80° West).
When these indexes are positive it means that there is El Niño and when they are negative it means there is La Niña.

Here are the areas of the ocean where averages of SST
are measured to calculate the ENSO indexes

This graph was created and is updated according to NOAA data
- - Then you can follow the evolution of ENSO phases with the SOI which is an index of the atmosphere, calculated with the atmospheric pressure of Darwin (Northern Australia) and Papeete (Tahiti AABF station managed by Météo France). Indeed, when the index is negative, it is an El Niño phase and when it is positive it is a La Niña phase unlike other indexes.
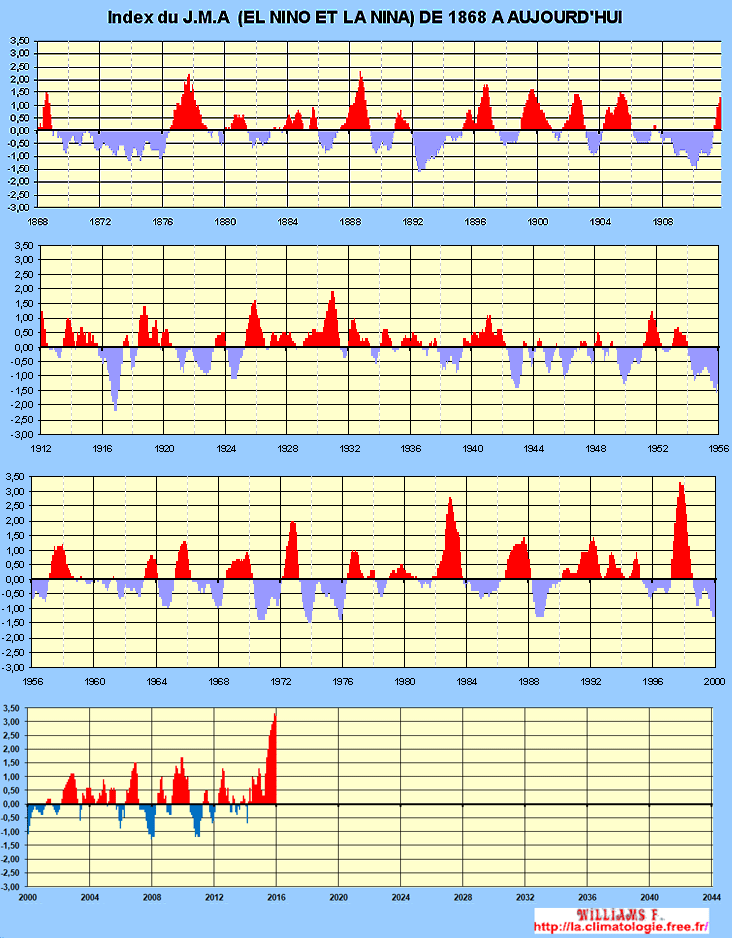
- - There is also the J.M.A, (Japan Meteorological Agency) a new index based also on SST. It is applied on an average of five months (4° North - 4° South) and (150 ° West - 90° West). The monthly data of this index range from 1848 until now. When this index is positive it means that there is El Niño and reverse when it is negative.

This graph was created and is updated according to
Center for Ocean-Atmospheric Prediction Studies (COAPS) - - Then comes the T.A.O. (Tropical Atmosphere Ocean) an index created from more than 70 moored buoys covering the equatorial Pacific between 8° North and 8° South. They measure the atmospheric surface conditions (wind, humidity, precipitation, radiative flux) and oceanic conditions of the surface and subsurface up to 500 m of depth (the temperature, currents, and salinity). Everything is organized by the United States, France, the Japan and Taiwan.


sexta-feira, 11 de novembro de 2016
FORMAÇÃO DE GRANDE COMPLEXO CONVECTIVO NO SUL DO BRASIL

IMAGENS DAS 09H DE 11.11.2016


RADAR DO PARANÁ

DESCARGAS ELÉTRICAS

PRESSÃO ATMOSFÉRICA E CHUVA

IMAGEM ÀS 12H JÁ MOSTRA A DISSIPAÇÃO

Baixa pressão aumenta a chuva no PR
11/11/2016 às 11:22
por Maria Clara Machado
por Maria Clara Machado
Grandes áreas de instabilidade associadas a um novo sistema de baixa pressão no Paraguai já formam nuvens muito carregadas sobre o oeste do Paraná. A sexta-feira (11) começou com chuva forte na região e rajadas de vento que já chegaram a 90 km/h em Marechal Cândido Rondon. Ventos fortes, acima dos 70 km/h, também foram observados no interior do Rio Grande do Sul durante a madrugada. Segundo o Instituto Nacional de Meteorologia (INMET), São Luiz Gonzaga teve rajadas de 78 km/h, Bento Gonçalves de 73 km/h e Santa Rosa de 71 km/h.

Essas nuvens pesadas tendem a se intensificar e se espalhar pelo Paraná e há alerta de mais temporais com ventos fortes no decorrer desta sexta-feira. "O pior da instabilidade fica sobre o Paraná, mas Santa Catarina e o Rio Grande do Sul também terão pancadas de chuva", avisa a meteorologista Fabiana Weykamp.

Mar agitado
Um ciclone extratropical está em alto mar, afastado da costa, na altura do Rio Grande do Sul e provoca uma elevação das ondas no litoral gaúcho nesta sexta. As rajadas de vento podem alcançar 70 km/h nas áreas litorâneas do Rio Grande do Sul e no sul de Santa Catarina. Durante o fim de semana, a agitação marítima permanece no litoral dos dois estados. O aviso é da Marinha do Brasil, que prevê mar grosso, mas até o momento não há alerta para ressaca na Região Sul.
Fim de semana prolongado
O fim de semana prolongado do feriado de 15 de novembro vai continuar com pancadas de chuva no Paraná e ainda há risco de chuva forte, especialmente no norte do estado. Santa Catarina e o Rio Grande do Sul ficam livres da chuva. As pancadas de chuva retornam aos três estados no início da semana com a chegada de uma nova frente fria e a formação de novas áreas de instabilidade.
quinta-feira, 6 de outubro de 2016
NEVE, TORNADOS E FURACÃO NOS EUA NESSE INÍCIO DE OUTONO

RADAR E IMAGEM SATÉLITE DA MANHÃ DE 06.10.2016 MOSTRA EM AZUL NEVE, EM AMARELO TORNADOS E NA FLÓRIDA O FURACÃO MATTHEW.

QUADRO DE PREVISÃO
Clique numa região colorida do mapa para ver detalhes.
U.S. Legenda de Aviso Meteorológico
| Aviso de Tornado |
| Vigilância para Tornado |
| Aviso de Trovoadas |
| Vigilância para Trovoadas |
| Informação sobre Tempo Invernal |
| Alerta de Ventos Fortes |
| Aviso de Inundações |
| Vigilância de Inundações/ Informação sobre Inundações |
| Informação Local de Furacão |
| Alerta de Calor |
| Alerta de Nevoeiro Cerrado |
| Alerta de Tempo Favorável a Incêndios |
| Vista de um furacão |
| Aviso de furacão |
| Vista de tempestade tropical |
| Aviso para tempestade tropical |
| Informação Especial sobre o Tempo |
Domingo, 2 de octubre de 2016
En Columbia Británica ya cayó la primera tormenta de nieve de la temporada

Muchos parecen sorprendidos por lo verde que se ha mantenido ciudades como Montreal y Toronto en este inicio del otoño. Pero otros a lo largo del país ya sacaron sus palas.
En el norte de Columbia Británica ya se registró la primera tormenta de nieve de esta temporada, y eso que el invierno no ha comenzado todavía.
Este sábado se registraron entre 10 y 20 centímetros en los sectores de Peace River District y Fort Nelson, ambos en Columbia Británica, en el oeste del país.

Sin embargo, las temperaturas de otoño hacen desaparecer la nieve rápidamente, pues el termómetro estuvo alrededor de cero sólo por algunas horas.

Como era de esperarse, las redes sociales se llenaron de fotos de habitantes del sector, sorprendidos por iniciar el mes de octubre con la ciudad pintada de blanco:

Assinar:
Postagens (Atom)